Active Listings
For Sale (1)

$440K
Unit 4072 bd2 ba950 sf
$463/SF103 DOM
For Rent (2)

$3K
Unit 4072 bd2 ba950 sf

$4K
Unit 2012 bd2 ba990 sf
$4/SF
Stay informed on Miami condo trends
What we cover
1605 BAY RD, Miami Beach 33139
1982
Year Built
32
Units
1
For Sale
$440K
Avg Price
$461
Sale $/SF
2
For Rent
$3,450
Avg Rent
$3.54
Rent $/SF
-0.8%
YoY
For Sale
1
For Rent
2
Investor-Owned
72%
Avg HOA
$716/mo
Address
1605 BAY RD, Miami Beach, 33139
Neighborhood
Miami Beach
Year Built
1982
Total Units
32
Avg Unit Sqft
841 SF
Tier
Premium
Avg $/SF
$460.56
Avg Rent
$3,450/mo
Rent $/SF
$3.54/SF
HOA Range
$716 – $716
Neighborhood Rank
Top 23%
Avg Unit Value
$302K
Total Sales (All-Time)
96
Sale Price Trend ($/SF)
$457
Rental Price Trend ($/SF)
$3.33
Building Activity
Closed Sales (120d)
0
transactions
Low volume
Active Listings
For Sale (1)
$440K
Unit 407For Rent (2)
$3K
Unit 407$4K
Unit 201Recent Sales
| Date | Price | $/SF | Bed/Bath | SF |
|---|---|---|---|---|
| Jul 23, 2025 | $320K | $457.14 | 1/1 | 700 |
| May 5, 2025 | $440K | $442.21 | 2/2 | 995 |
| Nov 29, 2024 | $470K | $484.54 | 2/2 | 970 |
| Jul 29, 2024 | $330K | $458.33 | 1/1 | 720 |
| May 22, 2024 | $440K | $453.61 | 2/2 | 970 |
| Oct 2, 2023 | $580K | $610.53 | 2/2 | 950 |
| Aug 12, 2022 | $300K | $428.57 | 1/1 | 700 |
| Jul 15, 2022 | $320K | $457.14 | 1/1 | 700 |
| Mar 14, 2022 | $260K | $361.11 | 1/1 | 720 |
| Feb 28, 2022 | $445K | $449.49 | 2/2 | 990 |
| Jun 18, 2021 | $395K | $407.22 | 2/2 | 970 |
| Jun 15, 2021 | $450K | $473.68 | 2/2 | 950 |
| May 1, 2021 | $228K | $325.71 | 1/1 | 700 |
| Apr 27, 2021 | $205K | $284.72 | 1/1 | 720 |
| Apr 7, 2017 | $390K | $391.96 | 2/2 | 995 |
| Mar 28, 2017 | $430K | $434.34 | 2/2 | 990 |
| Mar 17, 2017 | $365K | $384.21 | 2/2 | 950 |
| Feb 24, 2017 | $255K | $364.29 | 1/1 | 700 |
| Aug 17, 2015 | $230K | $319.44 | 1/1 | 720 |
| Jun 12, 2015 | $349K | $352.53 | 2/2 | 990 |
| Mar 31, 2015 | $220K | $314.29 | 1/1 | 700 |
| Feb 3, 2015 | $118K | $118.79 | 2/2 | 990 |
| Jun 9, 2014 | $315K | $449.29 | 1/1 | 700 |
| May 9, 2014 | $355K | $365.98 | 2/2 | 970 |
| Mar 31, 2014 | $315K | $437.5 | 1/1 | 720 |
Total Units
32
Avg Sqft
841 SF
Avg Assessed
$289K
Owner-Occupied
28%
Tax & Ownership
Investor-Owned
72%
Owner-Occupied
28%
Avg Assessed Value
$289K
Avg Taxable Value
$275K
Effective Year Built
1982
Zoning
4000
Unit Mix
Avg 705 SF
Avg 976 SF
Unit Directory
Showing 10 of 32 units| Unit | Beds | Baths | SF | Assessed | Owner | Last Sale | $/SF | Sale Date |
|---|---|---|---|---|---|---|---|---|
| 201 | 2 | 2 | 990 | $364K | ✓ | $445K | $449 | Feb 2022 |
| 202 | 2 | 2 | 995 | $368K | — | $440K | $442 | May 2025 |
| 203 | 1 | 1 | 700 | $244K | — | $210K | $300 | Sep 2004 |
| 204 | 1 | 1 | 700 | $244K | — | $220K | $314 | Mar 2015 |
| 205 | 1 | 1 | 700 | $244K | — | $149K | $213 | Dec 2003 |
| 206 | 1 | 1 | 720 | $255K | — | $260K | $361 | Mar 2022 |
| 207 | 2 | 2 | 950 | $136K | ✓ | $90K | $95 | Jul 1997 |
| 208 | 2 | 2 | 970 | $351K | ✓ | $470K | $485 | Nov 2024 |
| 301 | 2 | 2 | 990 | $365K | — | $104K | $105 | Jun 1998 |
| 302 | 2 | 2 | 995 | $321K | ✓ | $390K | $392 | Apr 2017 |
Top Agents in This Building

 Coldwell Banker
 Brown Harris Stevens
 ONE Sotheby's International Realty
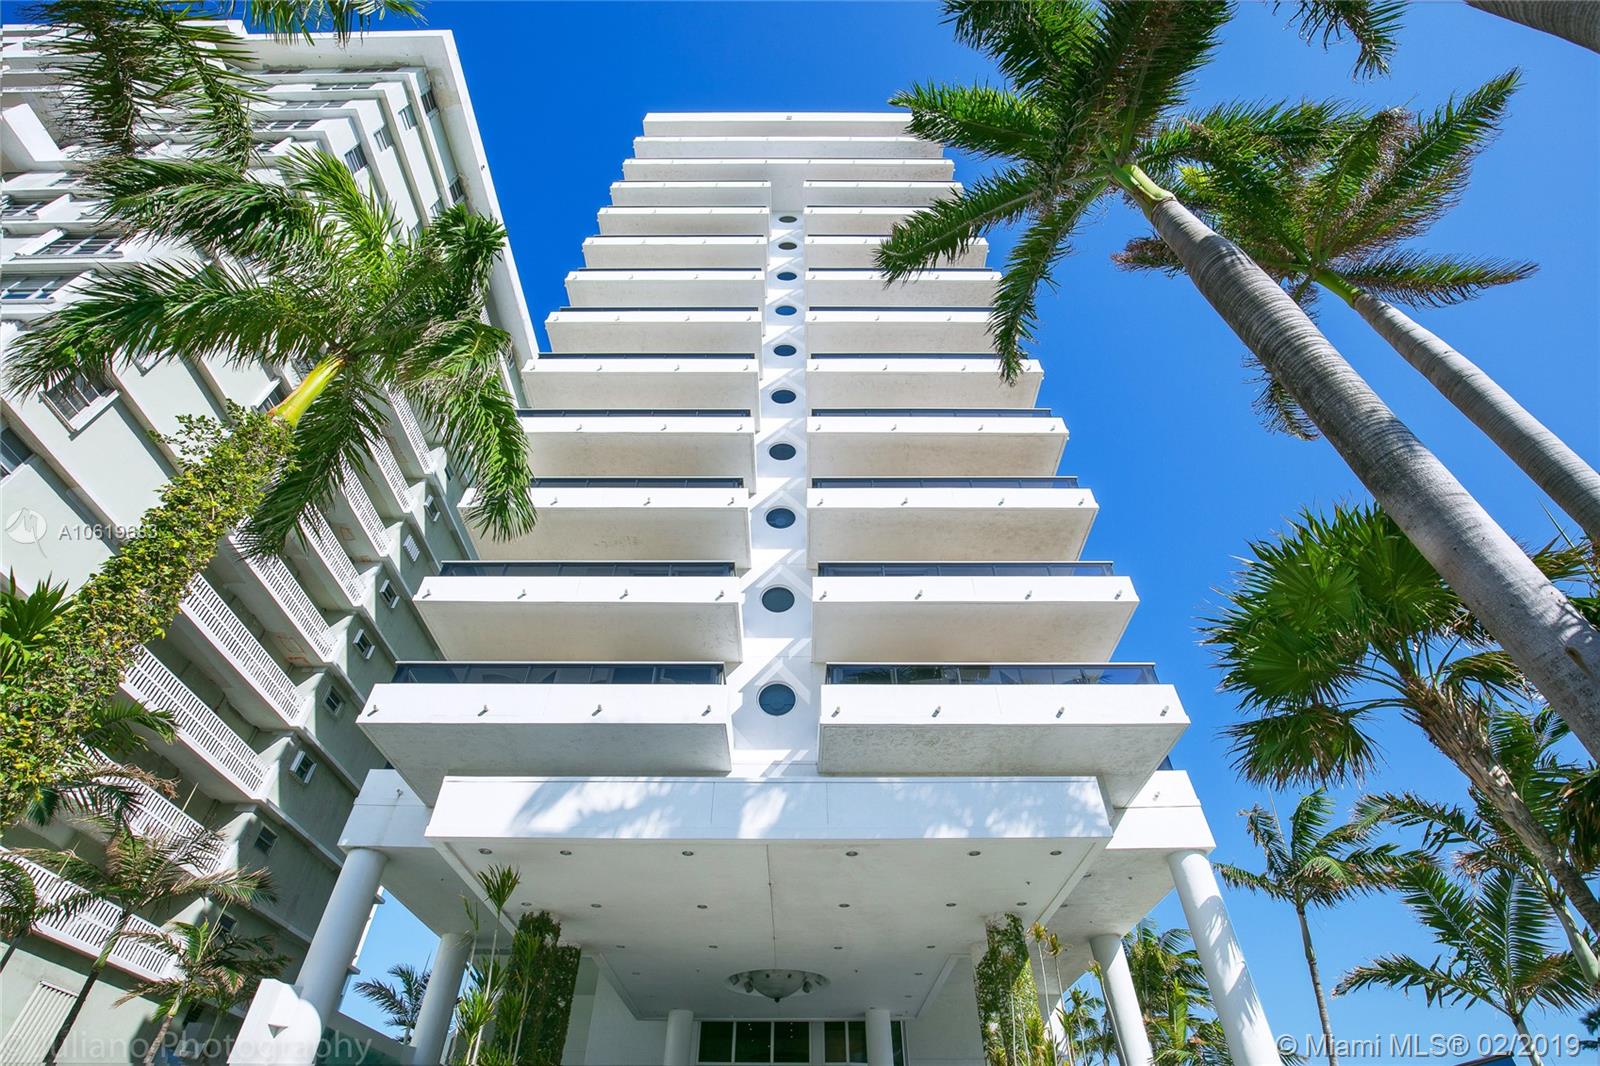 AG Real Estate Advisors
 Douglas EllimanColdwell Banker
Top Brokerages in This Building
| Brokerage | Agents | Sales | Volume |
|---|---|---|---|
| Coldwell Banker | 3 | 4 | $1.5M |
| Douglas Elliman | 3 | 3 | $1.1M |
M Miami Dreams Realty Inc. | 1 | 2 | $1.0M |
C City Intl R. E. Group, Inc. | 1 | 2 | $890K |
| ONE Sotheby's International Realty | 1 | 1 | $470K |


Be the first to know when a unit in BAY POINT EAST CONDO hits the market — for sale or rent.
Neighborhood
Miami Beach →
View all buildings in this area
Building Snapshot